A new book to help you build dashboards that make an impact.
Available now!
What people are saying about Dashboards that Deliver
“You've designed a gorgeous dashboard that relies on well-chosen charts and intuitive interactivity, but if you didn't continuously involve your end-users during development, your dashboard is likely to fail.
This book teaches a powerful and flexible process infused with critical themes from design thinking and agile development. It's illustrated with detailed examples, distilled from 50+ years of collective experience, and is written with humor and verve. It's my new textbook for my course at Kellogg.”
Steve Franconeri, Professor of Management and Organizations, Kellogg School of Management at Northwestern University
Want a peek into the book? Download three free chapters, including the Dashboards That Deliver framework overview.
“Steve, Jeff, Andy, and Amanda bring unmatched expertise to this guide. In Dashboards that Deliver, they’ve distilled years of experience into a thoughtful, usable framework—brought to life through a plethora of real-world examples.
It's full of ideas you can use to elevate both your dashboards and the conversations around them. A fantastic resource.”
Cole Nussbaumer Knaflic, CEO and author of storytelling with data
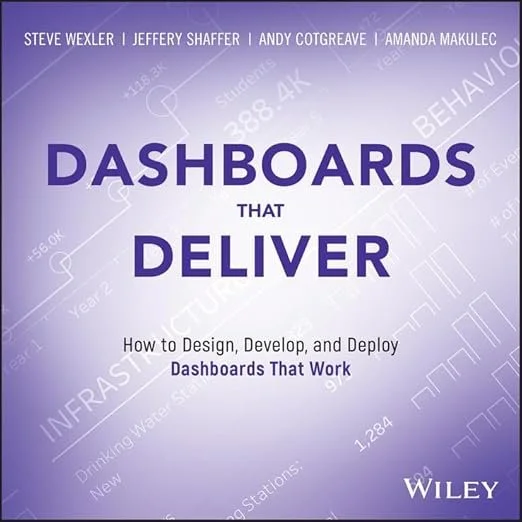
Dashboards That Deliver: How to Design, Develop, and Deploy Dashboards That Work teaches you a complete process of dashboard creation, from the initial spark, through discovery and prototyping, to release and maintenance.
Ever heard that you should '“design for your audience” when you’re making a dashboard, but not sure where to get started? Or have you been asked to measure the success of your dashboard, but quantifying its value feels abstract?
This new book addresses the human and social factors in making successful dashboards. You'll learn how to apply the process whether you're a sole data analyst, or the head of business intelligence in a large enterprise.
Also included are over a dozen detailed chapters featuring real-world dashboards from different industries (healthcare, transportation, etc.), departments (finance, marketing, human resources), and platforms (print, desktop, cellphone, etc.). There are dashboards designed for different audiences, including one that has had 2.5 billion views. Each one has a unique creation story you can learn from and apply.
The expert authors have a combined fifty-plus years of hands-on experience helping people in hundreds of organizations build effective dashboards. They have seen multiple successes and failures, bringing their own stories and empathy to help readers survive and thrive in a rapidly changing data landscape.

An adaptable framework
Building on our combined 50+ years of experience, we’ve mapped out a framework anyone can use to build better dashboards, no matter what tool you’re using.
We use principles from UX design and Agile blended with best practices in data visualization to give you the roadmap you’ve been looking for. Even if you’re using AI as a collaborator in your design process, you’ll find the framework helps you better utilize AI tools in your workflow.
Real World Scenarios
Learn how real organizations have built their own dashboards that deliver, highlighting parts of the DTD Framework put into practice. From a dashboard built for a high school bowling coach to a dashboard with more than 2.5 billion views around the world, you’ll find insight in each scenario that you can apply in your work.
Meet the Authors
-

Andy Cotgreave
-

Amanda Makulec
-

Jeffrey Shaffer
-

Steve Wexler
“Years of experience coupled with practical advice and a touch of humor make Dashboards That Deliver a go-to reference book that all dashboard practitioners should keep close at hand.”
Jim Sterne, Author, Keynoter, Target Marketing of Santa Barbara
"Dashboards that Deliver is the practical, end-to-end guide the data world has been missing. Written by leading experts, it's refreshingly real about what it takes to create dashboards that truly transform organizations. With a clear, actionable framework covering planning to post-launch, this book will help you make better decisions – and lasting impact.”
Dr. Morgan Depenbusch, People Analytics Leader (Google, Snowflake)
Dashboards that Deliver Table of Contents
Get a glimpse into the inside of Dashboards that Deliver, from chapters on our design framework to chapters on AI and data visualization, in the Table of Contents below.
-
Chapter 1 - Why Dashboards Matter
Chapter 2 - Dashboards that Deliver Framework
Chapter 3 - Dashboard Teams and Roles
Chapter 4 - Spark
Chapter 5 - Discovery
Chapter 6 - Discovery Techniques
Chapter 7 - Prototyping
Chapter 8 - Key Considerations for Dashboard Design
Chapter 9 - Development and User Testing
Chapter 10 - Release and Adoption
Chapter 11 - Maintenance and Enhancements
-
Chapter 12 - Teach Coaching Dashboard (Kevin Flerlage)
Chapter 13 - Fitness Goal Tracker (Andy Cotgreave)
Chapter 14 - eCommerce Dashboard (Dorian Banutoiu)
Chapter 15 - Recency, Frequency, Monetary (RFM) Analysis (Nicholas Oury)
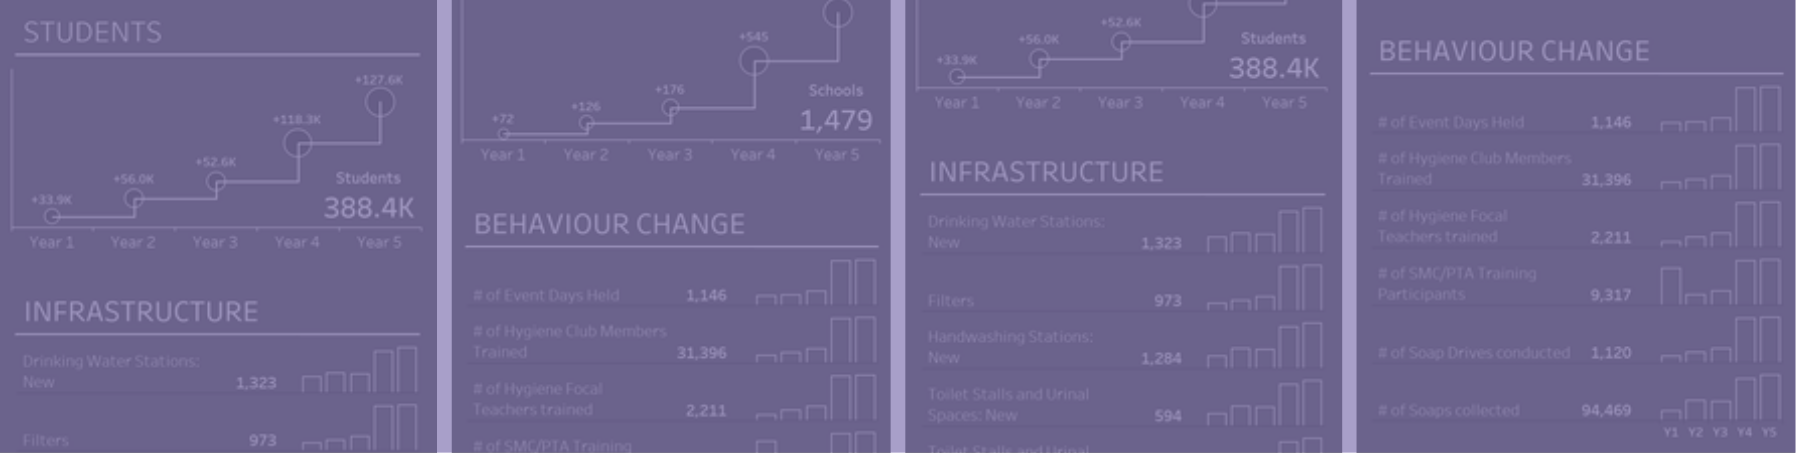
Chapter 16 - Splash Project WISE Dashboard (Jeff Shaffer and Chris DeMartini)
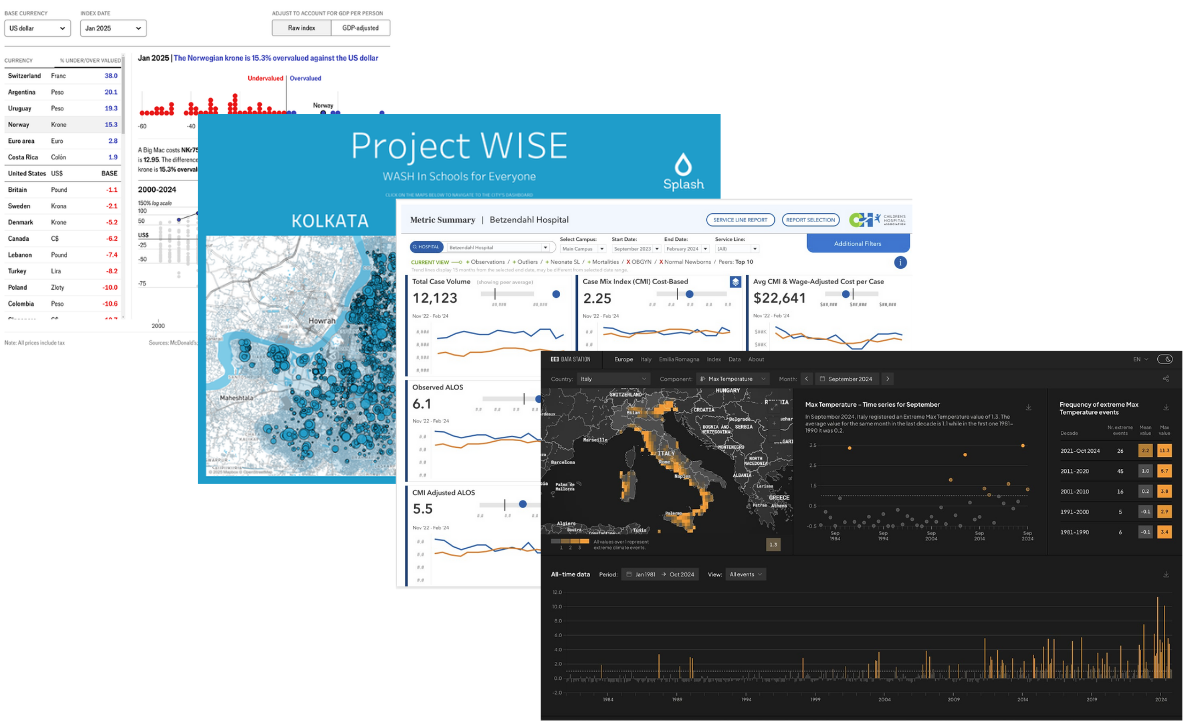
Chapter 17 - Big Mac Index (Matt McLean and The Economist data team)
Chapter 18 - Guided Pathways (Kimberly Coutts)
Chapter 19 - Childrens Hospital Association Dashboard (CHA and Lindsay Betzendahl with HealthDataViz)
Chapter 20 - Metric Tree (Klaus Schulte and Merlijn Buit)
Chapter 21 - Insurance Broker Portfolio Dashboard (Ellen Blackburn)
Chapter 22 - Banking Executive Financial Dashboard (Will Perkins)
Chapter 23 - E3CI Data Station (Cinzia Bongino, Ferderica Guerrini, Alberto Arlandi)
Chapter 24 - Professional Racing Team Race Strategy Dashboard (Michael Gethers)
Chapter 25 - Johns Hopkins University Coronavirus Resource Center
Chapter 26 - NASA’s Early Information Center and earth.gov (NASA Scientific Visualization Studio)
-
Chapter 27 - BANs
Chapter 28 - Dynamic Duos
Chapter 29 - Defaults v. Design: The Pitfalls of Software Defaults
Chapter 30 - What is a dashboard?
Chapter 31 - Numbers in Context and Critical Thinking in Data Analysis
Chapter 32 - Generative AI and Data Analytics
Chapter 33 - Use Dashboards to Find Stories, Not Tell Them
Chapter 34 - Sparring Partners
Chapter 35 - Leverage the Power and Generosity of the Data Visualization Community